Program Evaluation & Outcomes Analysis (SQL)
Quick Scan
Domain
Child welfare program evaluation (simulated data)
Primary Question
How can structured, well-documented data be used to examine relationships between program funding, service delivery, and permanency outcomes across regions and programs?
What This Project Demonstrates
Relational data modeling • Documented SQL workflows • Outcome and cost-per-outcome evaluation • Audit-ready analytical logic
Tools
SQL • Relational database design
Transferable Insight
The underlying data model and SQL workflows mirror research data management patterns used across regulated, human-centered domains to support transparent evaluation, reproducibility, and reuse beyond a single program or context.
This project demonstrates how structured data analysis can support child welfare program evaluation, funding accountability, and outcome monitoring. Using simulated data and documented SQL queries, the analysis links program funding to child permanency outcomes (reunification, adoption, and aging out) to support continuous quality improvement (CQI) and leadership decision-making.
Context & Motivation
Child welfare agencies must balance program effectiveness, fiscal responsibility, and equitable outcomes while meeting federal and settlement-related reporting requirements. Data used for these purposes must be accurate, transparent, and easy for non-technical stakeholders to interpret.
This project was designed to reflect real-world evaluation questions faced by public-sector agencies, including the following:
- Are program resources being used effectively?
- Are children achieving permanency outcomes on time?
- Are outcomes consistent across regions?
- How can data support targeted program improvement?
Key Evaluation Questions
1
How do program funding levels relate to permanency outcomes?
2
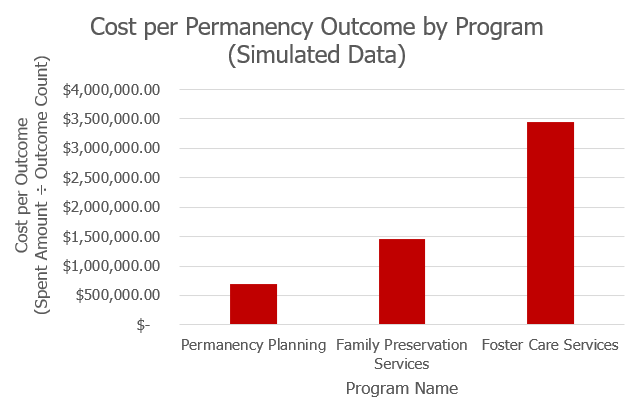
What is the cost per permanency outcome by program?
3
Are outcomes improving over time?
4
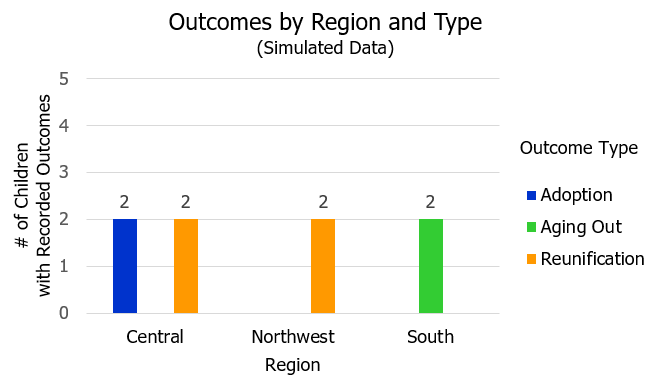
Are there regional differences in outcomes?
5
Where might leadership focus improvement efforts?
Data Model & Approach
The analysis uses a relational data model that connects
- Programs
- Program funding by fiscal year
- Child outcomes
- Geographic regions
SQL queries were used to
- Join funding and outcome data
- Validate data integrity
- Calculate performance measures
- Produce repeatable, auditable results
The structure emphasizes clarity, traceability, and governance, mirroring best practices used in public-sector evaluation.
Key Performance Measures
Budget Utilization Rate
Percentage of allocated funds spent during the fiscal year
Cost Per Permanency Outcome
Total program spending divided by the number of reunification and adoption outcomes
Permanency Outcome Rate
Percentage of children achieving permanency within the reporting period
Outcome Distribution by Type
Reunification, adoption, and aging out
Regional Outcome Comparison
Differences in outcomes across geographic areas
Example Insights
Using the performance measurs above, the analysis highlights
- Programs achieving strong outcomes with efficient use of funds
- Programs with higher costs but lower permanency rates
- Regional variation that may warrant targeted support
- Trends indicating improvement or decline over time
These insights demonstrate how data can move beyond reporting to support program improvement and strategic decision-making actively.
Tools & Skills
- SQL (query design, joins, aggregations, documentation)
- Relational data modeling
- Program evaluation methods
- Performance measure development
- Data governance and ethical analysis
Ethical Use of Data
All data used in this project is fully simulated.
The project emphasizes
- Privacy protection
- Aggregate reporting
- Responsible interpretation of outcomes
- Clear documentation to avoid misuse
Ethical data use is essential when evaluating programs that affect children and families.
Technical Documentation
The complete SQL implementation, including schema design, performance measures, and annotated queries, is available in a public GitHub repository.
Effective program evaluation connects data to decisions and decisions to better outcomes for children and families.