Portfolio Showcase: Auditable Intelligence for Policy

Quick Scan

Domain
Institutional effectiveness and equity analytics (simulated data)

Primary Question
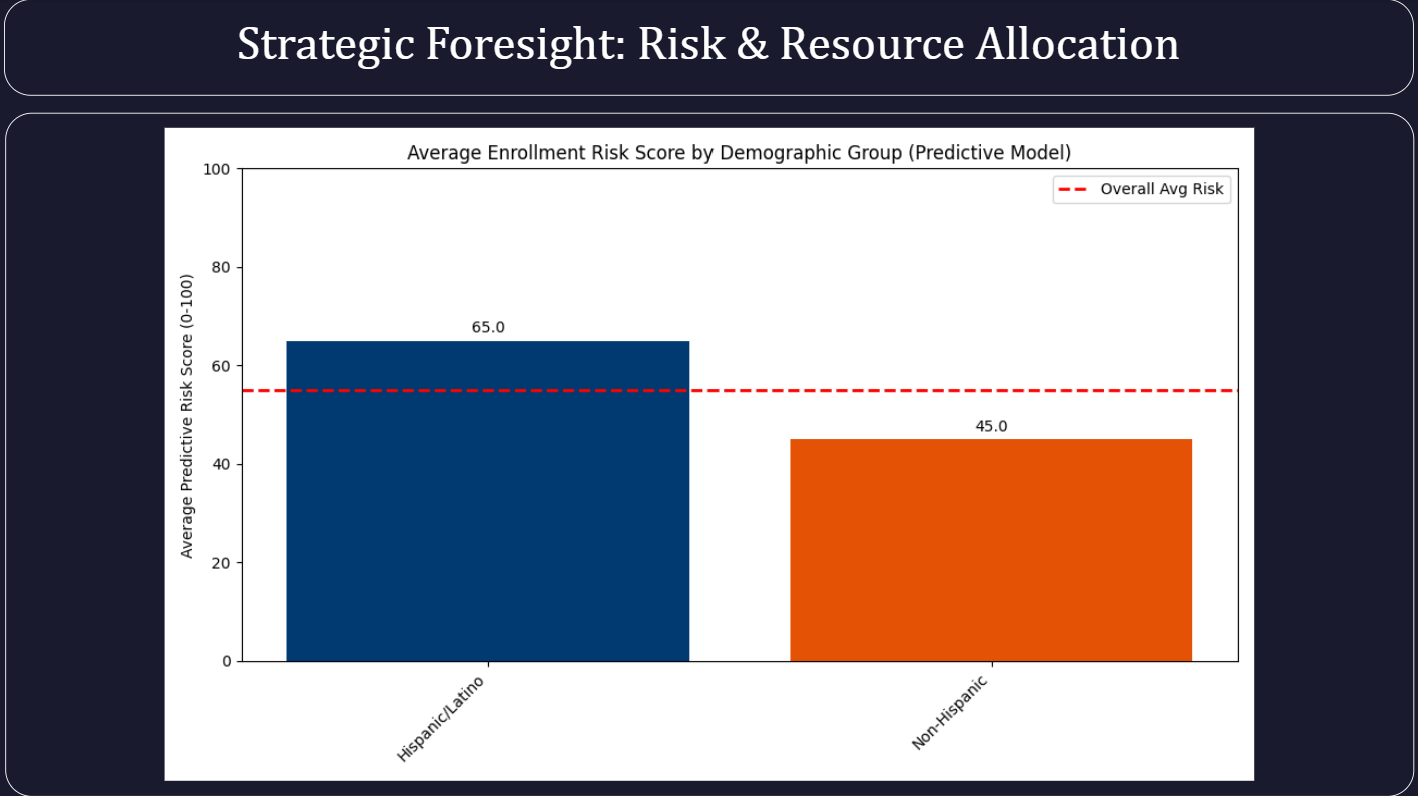
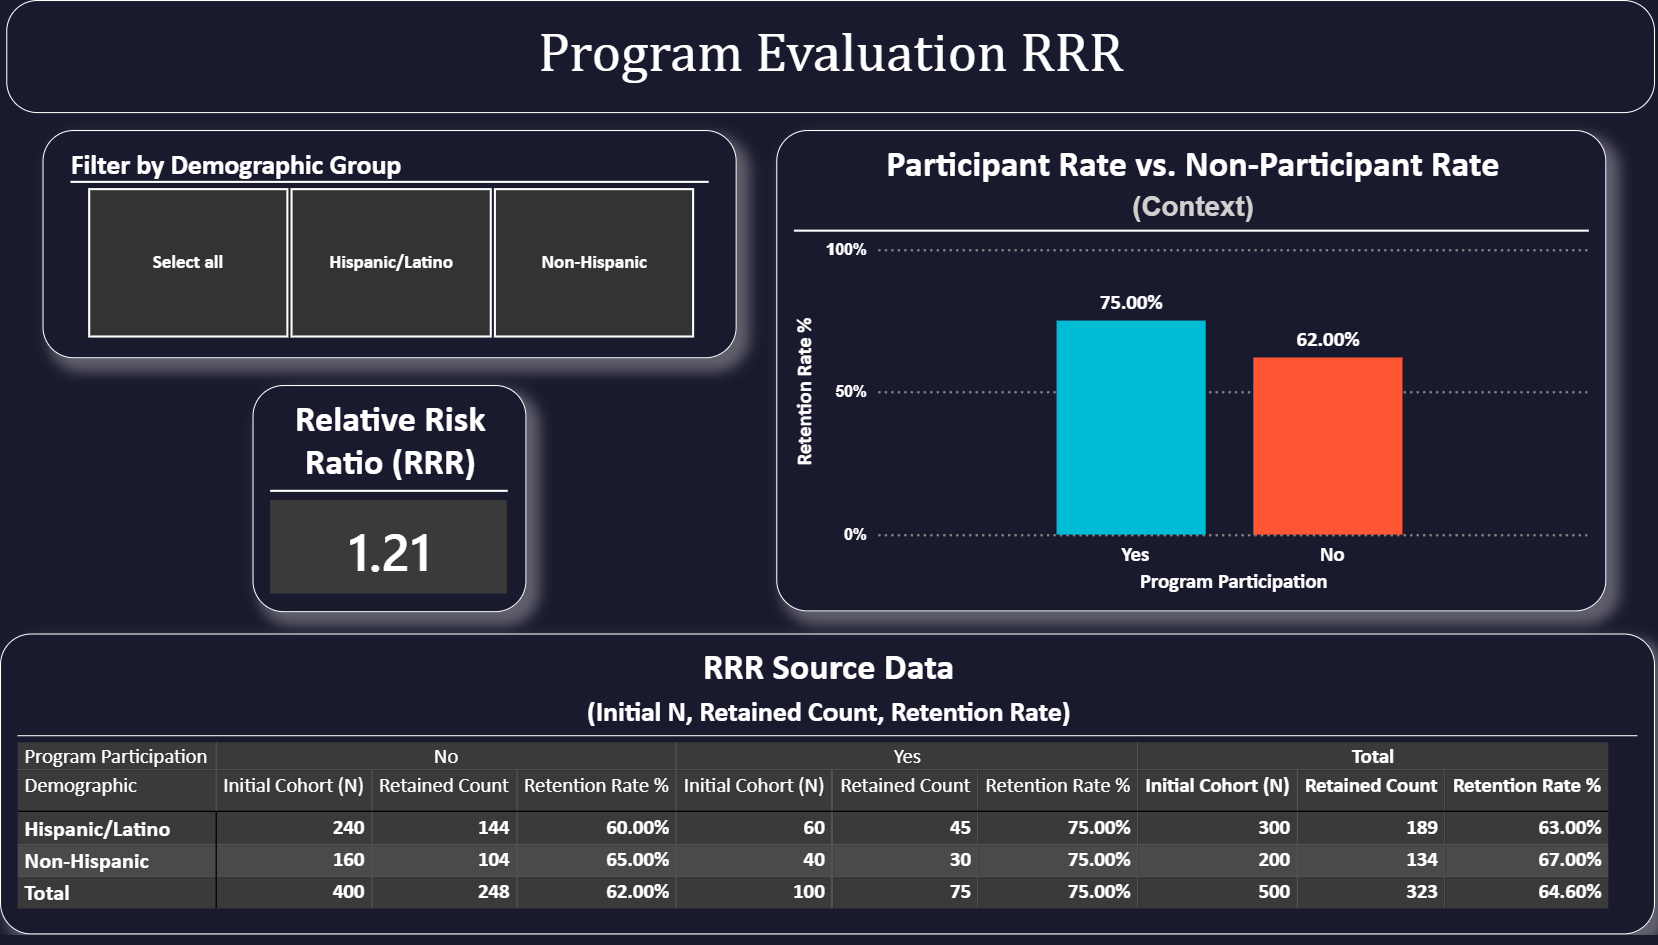
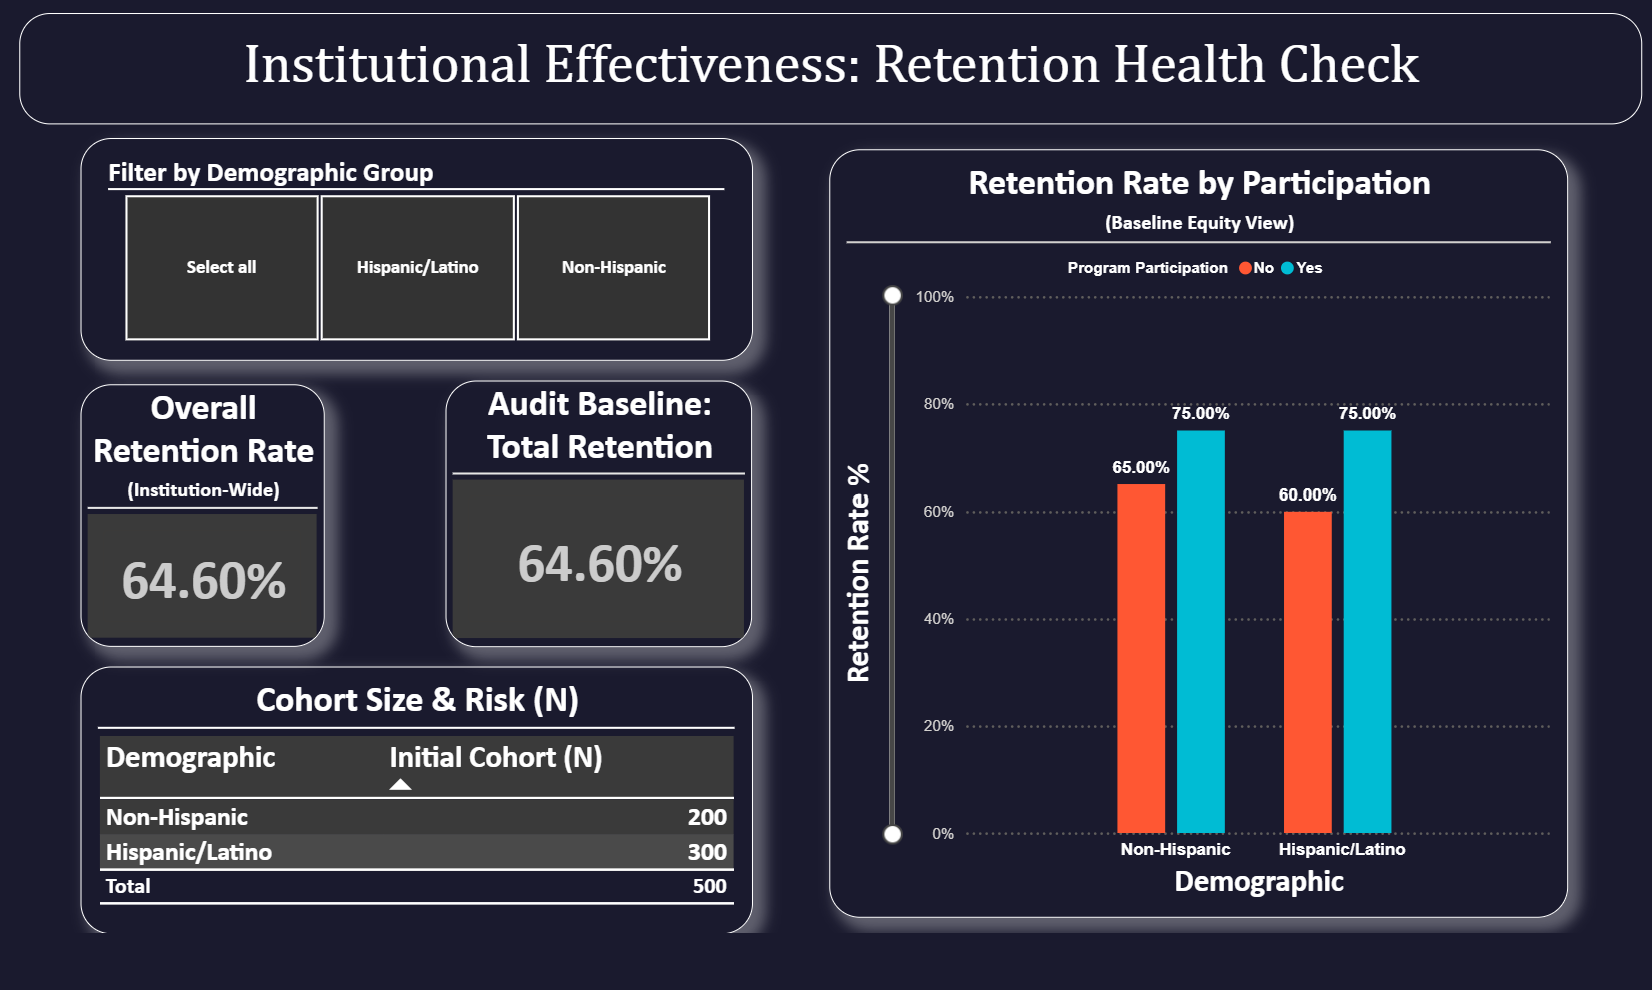
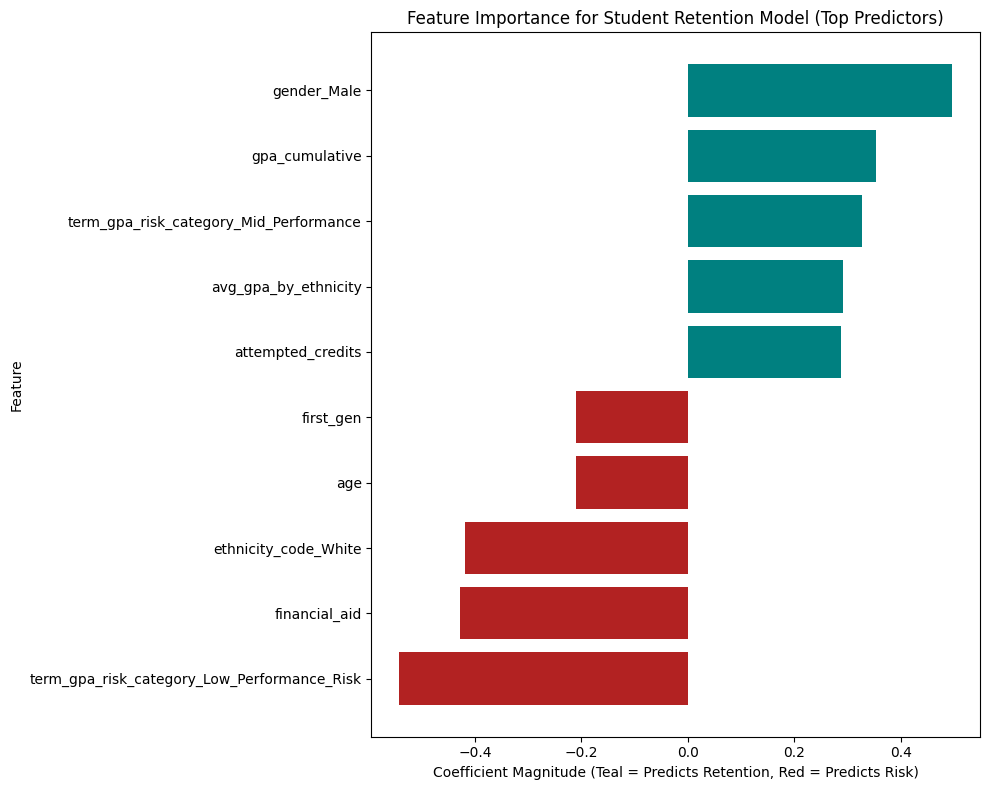
How can structured data, clear documentation, and reproducible pipelines support identification of differential outcomes or elevated risk that may warrant further review?

Analytics Demonstrated
Reproducible data pipelines • Equity-focused evaluation metrics • Interpretable predictive modeling • Executive-facing, auditable reporting

Tools
PostgreSQL / SQL • Python (scikit-learn) • Power BI / DAX

Transferable insight
The methods demonstrated emphasize data governance, documentation, and interpretability, reflecting the research data management practices needed to responsibly support evaluation, equity assessment, and decision-making across academic and public-sector settings.

This project demonstrates the successful transformation of raw institutional data into auditable, actionable intelligence designed to drive program effectiveness and ensure equitable resource allocation—a core mandate for the Office of Performance and Accountability at CYFD.

The solution is an end-to-end evaluation system that moves beyond simple compliance reporting to objectively quantify social equity gaps and measure the return on investment of targeted support programs. It showcases expertise in advanced quantitative modeling, data governance, and clear communication of high-stakes findings.

Strategic planning dashboard using predictive modeling to guide resource allocation. The display includes a stacked bar chart showing high, medium, and low-risk operational cohorts, and tables detailing required budget and resource hours per financial risk group.
Strategic Foresight & Resource Allocation: This executive dashboard synthesizes predictive risk modeling (Python/Scikit-learn) with program cost data to drive evidence-based resource allocation. It identifies high-risk participant cohorts requiring immediate intervention, allowing leadership to maximize the ROI of targeted programs and inform strategic, forward-looking policy adjustments for continuous quality improvement. (Note: The embedded Python visual components may not render in the static online viewer, but they represent the core predictive analytics engine.)

Three Pillars of Impact

1. Advanced Evaluation Metrics for Equity

I developed and implemented the Relative Risk Ratio (RRR) as the key analytical metric. This goes beyond simple rate comparison to provide and effect size, quantifying the precise difference in outcomes between demographic groups or program participants.

Impact: The RRR provides irrefutable evidence for strategic decision-makers, answering the question: “Is this intervention moving the needle on equity, and by how much?”

Statistical dashboard for Program Evaluation showing the Relative Risk Ratio (RRR) calculation. The visualization features tables comparing intervention and control groups, and a scatter plot demonstrating the statistical significance of program impact on cost drivers and productivity metrics.
Program Efficacy and Equity Gap Quantification: This statistical dashboard rigorously measures the effectiveness (effect size) of targeted programs using the Relative Risk Ratio (RRR). The RRR is utilized to objectively quantify social equity gaps, providing the necessary evidence to justify resource allocation and inform policy changes focused on fairness and access.

2. Predictive Risk Modeling and Early Intervention

Using Python (Scikit-learn), I embedded a Logistic Regression model directly into the Power BI dashboard to forecast student attrition risk based on early academic and demographic data (e.g., financial vulnerability).

Impact: This model allows administrators to proactively target high-risk individuals for early intervention, shifting resources from retrospective reporting to Continuous Quality Improvement (CQI)

Dashboard titled "IE Retention Health Check" displaying key financial and operational performance indicators (KPIs), resource utilization rates broken down by service line, and a high-level trend analysis using bar charts and gauge visuals.
Core Compliance and Regulatory Health Check: A high-level, interactive dashboard providing an immediate, auditable snapshot of key performance indicators (KPIs) and operational compliance. This tool supports executive decision-making by tracking institutional performance against accreditation and regulatory benchmarks, serving as the foundational compliance layer for the entire evaluation system.

3. Data Governance and Auditable Compliance

My background in high-stakes regulatory compliance was applied to the data architecture. The project ensures a verifiable data trail from the PostgreSQL source to the final Power BI dashboard, minimizing reporting risk.

Technical Execution: All data metrics are backed by a comprehensive Data Dictionary and Advanced SQL to ensure calculations are transparent and repeatable, meeting the rigorous standards necessary for federal reporting and oversight.

Bar chart displaying feature importance for a student retention model.
Actionable Predictive Risk Model: This visualization is the output of a logistic regression model trained on features engineered in PostgreSQL. It identifies high-risk cohorts for proactive intervention (CQI). The model's interpretability, ensured by custom SQL `CASE WHEN` logic, guides policy leaders to focus resources on the most relevant non-academic barriers (e.g., financial strain) that predict adverse outcomes.

Technical Summary

Component
Tool / Language
Purpose
Dashboarding
Power BI / DAX
Visualization and calculation of complex metrics (RRR)
Modeling
Python / Scikit-learn
Development and embedding of the predictive risk model
Data Source
PostgreSQL / Advanced SQL
Robust data governance, schema definition, and complex query construction

Johnny A. Kenton, PhD

Thank you for reviewing my work.
All models and dashboards are based on simulated data.

Built in WordPress with Elementor